
How to calculate line balancing
@rgemas · · 9 min read
We have calculated the line's efficiency and the operator's bonus. Both calculations assume the line is balanced: every operator has work in front of them and nobody waits idle. This post is the arithmetic behind that assumption. How many operators does a model need, where does that number come from, what is the line's balance in percent, and how many minutes a day does the imbalance cost?
The definitions and shop-floor examples come from Arge Bilişim's article “The Arge Bilişim Assignment Optimization Algorithm” and from the page of our line balancing video, both quoted from the English editions on our site. The formulas are the standard industrial engineering definitions. Worked numbers that are not in those sources are marked “our example”.
What is line balancing?
The definition on our video page, in lean terms:
Line balancing (yamazumi) is, in lean thinking, the smooth and balanced sequencing of work steps so that the workload is shared in a levelled way. What makes it hard in apparel is how small the differences between operations are.
The article says the same thing through the line's goal:
Line balancing aims to maximize machine and labor utilization by equalizing the speeds of these workstations.
The logic of the calculation is in those two sentences: give every station a workload that finishes in the same time. Four numbers do that: takt time, people per operation, operator loading and balance efficiency.
The bottleneck sets the capacity
First, the cost of an unbalanced line. The article:
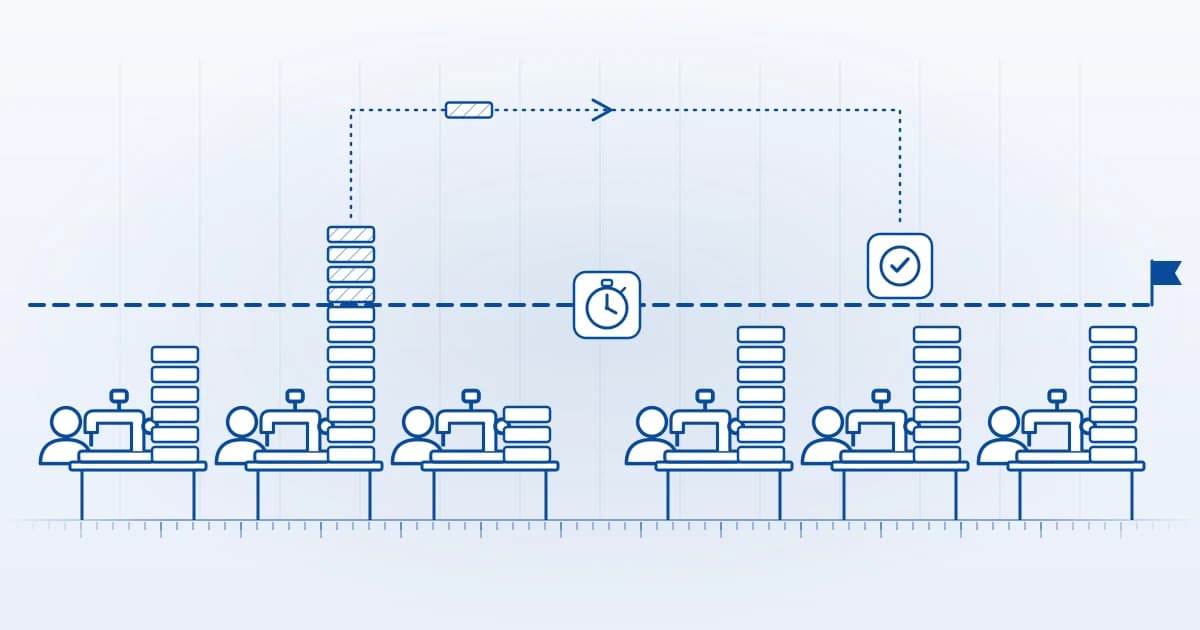
For each operation on the production line to be performed, the processes before it must be completed. If you have not set up a balanced line, bottlenecks will form within the line. As a result, some operators will wait idle while work piles up at other points. And this causes a loss of productivity. The station where these pile-ups are greatest, that is, the weakest station in the flow, will also determine the capacity of your production line.
As the simplest example, suppose a product passes through 5 separate processes. Assume each has a production capacity of 100 units per hour, but the station in 2nd position has a capacity of 90 units per hour. In that case, if you have not balanced your line, work will constantly pile up from the first station to the second while the downstream operators wait idle, and you will lose 10 units of production every hour.
Our arithmetic: the line's capacity is the slowest station's capacity, 90 units an hour. The other four stations stand idle for a tenth of every hour; over a nine-hour day that is 216 minutes across the four of them. Line balancing is the calculation that wins those minutes back.
How to calculate takt time
Takt time is how often a finished piece must leave the line to hit the daily target. It is the yardstick of balancing: every station's workload has to fit under it.
Our example: a 540-minute shift and a daily target of 900 pieces.
One piece every 0.6 minutes. Any operation whose standard time exceeds 0.6 minutes has to be split across more than one operator.
How many people per operation?
This is the calculation behind the list the engineer hands the line supervisor. Multiply the operation's standard time by the daily target, then divide by the minutes in the day and the target efficiency:
With a target efficiency of 1.00 this is the same as dividing the standard time by the takt time. Our example, a six-operation model, standard times in minutes:
- Front join 0.60 → people
- Side seam 0.90 → people
- Sleeve attach 1.20 → people
- Collar attach 1.50 → people
- Hemming 0.60 → people
- Final inspection 0.45 → people
Total standard time 5.25 minutes, total 8.75 people. The 1.5 next to side seam is the most familiar line on that list; the article describes what happens to it on the floor:
When an order arrives, the engineer first creates the model's operations and standard times. Then, at best, a target productivity is set, workloads are calculated, and this list is handed to the line supervisor. For example, the information 'the side-seaming operation needs 1.5 people' is given by the engineer. But which 1.5 people, and how productively those people previously worked on this operation, is not included. So this information remains merely theoretical.
The reason it stays theoretical is the efficiency in the denominator. The list is computed at 1.00; nobody on the floor works at 1.00. The article:
In reality, not only do operation times differ, but each operator's speed, competencies, skills and the difficulty levels of the jobs also differ from one another. Therefore, many such parameters must be considered when setting up the line.
Once efficiency enters the denominator the number moves. If the operators who will do side seam have a measured efficiency of 0.80:
The list said 1.5 people; with measured efficiency it is 1.9. The same correction explains the example in the efficiency post: a 12-standard-minute model, 1,000 pieces a day, 540 minutes. At an efficiency of 1.00, 22.2 people would do; at that line's efficiency of 0.74 the calculation gives 30. That line was set up with 30 operators.
Operator loading and the invisible 0.2 minutes
People per operation never comes out whole, and the line flows at the pace of its slowest station. That is why a small gap between two operators' jobs accumulates all day. The example on our video page:
Suppose one operator has a 0.9-minute operation and another a 0.7-minute one. Balanced to 0.9 minutes, the first operator's time is 100% loaded and the second's about 78%. Every piece carries a 0.2-minute wait, too short to give the operator extra work. In an irregular flow that wait goes unnoticed; everyone appears to work at the same pace.
The 78% is the operator's loading:
Cycle time is the pace the line actually runs at: the slowest station's time. The gap between the planned takt and the actual cycle time is how far the line is behind target. Loading converted into a day:
Over a 540-minute day the second operator's load is 540 × 0.78 ≈ 420 minutes: roughly 2 hours less than the other operator, spent on work that adds no value. That is both unfair and inefficient. Without measurability the difference is never seen.
How to calculate balance efficiency
One number for the whole line. Divide the model's total standard time by the number of stations times the cycle time:
For the two-operator line in the video, our arithmetic:
Balance loss 11.1%. Across the two operators' 1,080-minute day that is 120 minutes: the video's “roughly 2 hours”, reached by a second route.
In our six-operation example the result depends on how the fractional people are handled. If every operation is rounded up to whole people on its own, side seam gets 2, collar attach 3 and final inspection 1; the line is set up with 10 people:
If the fractions can be shared between operators, 9 people are enough (the theoretical minimum of 8.75, rounded up):
The operator in between is 540 minutes a day; in the 10-person setup the line's total idle time is minutes. The target is the same in both setups; the difference is how many people the same 900 pieces take.
How to assign a fraction of a person
The 9-person setup only works if “0.75 of a person” means something on the floor. Our video page solves it with bundles:
In a regular flow, take a bundle of 40 pieces. The first operator finishes a bundle in 40 × 0.9 = 36 minutes, the second in 40 × 0.7 = 28. The 8-minute gap is enough to assign the operator another job. Once standard-time gaps are visible, balancing the workload becomes straightforward: instead of "help out for an unspecified quantity", an operator can be told 5 bundles of side seam and 3 bundles of sleeve attach per hour.
Converted into bundles, a fraction becomes an assignable job. In our example, a first attempt puts final inspection's 0.75 and collar attach's 0.5 on one operator: three quarters of the day inspecting, a quarter attaching collars. That operator's loading comes out at , too much. Pair collar attach's 0.5 with side seam's 0.5 instead and leave final inspection's 0.75 on its own, and the highest loading among the nine is 1.00. Balancing is a few trials of this kind: minutes on paper, a supervisor's whole shift on the floor.
Who goes on which operation?
So far the calculation has answered “how many people”. On the floor the real question is “which people”. Measured efficiencies differ by operator, so the same 9-person setup gives a different line efficiency under different assignments. The article describes what leaving that decision to the supervisor's experience produces; the argemas assignment optimization module makes the assignment from measured operator efficiency and quality data, operation workload, model-operation similarity groups and difficulty grades. The result shown on our video page:
Based on past data, one operator is assigned to an operation at 41.5% efficiency, takes on 30.1% of that operation and spends 463 minutes of the day on it. The line the algorithm builds is calculated at 62.90% line efficiency.
The three figures are the three outputs of an assignment: the operator's share of the operation, the minutes of the day allotted to it, and the planned efficiency of the line as set up. The last one, 62.90%, is the line efficiency from the efficiency post, a different measure from the balance efficiency defined here. The module repeats the calculation on absenteeism and model changeover and re-plans the line; production planning reads its capacity from that plan. Details on the MES modules page and in the multi-line setup video. Line balancing and bottleneck management is one of the 17 topics of our lean transformation consultancy.
Do your own calculation
Our worksheet continues with the shift minutes (D) from the earlier posts. New inputs:
- Daily target, pieces (M)
- Each operation's standard time, minutes (N₁, N₂, …)
- Target or measured efficiency, e.g. 0.80 (P)
- Number of operators on the line as set up (R)
- The slowest station's time, i.e. the cycle time (Q)
If the cycle time is still above the takt time, the line will miss the target: add a person to the bottleneck station or split the operation first, then recalculate the balance.
Who does the calculation?
It would be easy if it were done once per model. In apparel the model changes several times a week, a few operators are missing every morning and measured efficiencies differ by person, so the calculation is redone at every change. The article's finding is that on the floor it is therefore mostly not done. When standard times, measured efficiency and bundle-based workload live in one system, line setup becomes a matter of arithmetic, and line efficiency measurement shows what the setup actually delivered.
If you would like to work out takt, people per operation and balance efficiency for your own model with us, a factory analysis starts with these numbers.
Sources
- The Arge Bilişim Assignment Optimization Algorithm. Academy articles.
- argemas: How are the line balancing and assignment problems solved? and Assignment optimization algorithm: multi-line automatic line setup.
- In this series: How to calculate sewing line efficiency and How to calculate an operator's bonus.
Share this post